2018
In late 2018, I started the project and added the rules of Tic Tac Toe, plus a basic MCTS player.
2019
In 2019, I converted the Shibumi Games project to use this library, and measured how win rates varied with MCTS iterations in several games. I tried adding neural networks, but never really got them to be stronger than basic MCTS with random playouts. I read several academic papers and books to try and understand the tools better.
2020
In 2020, I switched to a GUI using PySide, and supported multiprocessing. I published the first release on PyPI.
2021
Mar 2021
Plot opponent strength over time as it adjusts to wins and losses.
2023
Apr 2023
Restore the tool to plot win rates between different numbers of MCTS iterations.
May 2023
Switch MCTS search to limit by time instead of iterations, since that will make more sense when comparing neural network with random playouts.
Jul 2023
Resurrect the old neural network training code, but start by going through the painful Tensorflow installation of GPU support. After that worked, the old training code was broken, so try basing it on a regression tutorial.
Oct 2023
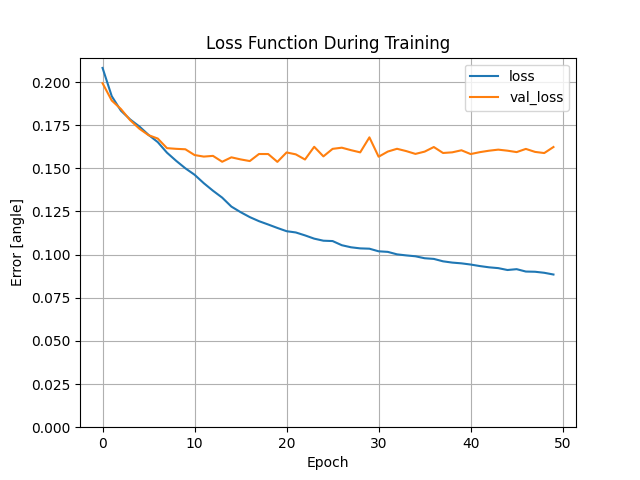
The training code runs, but doesn’t seem to learn much. Here’s the loss function as it trains on 10,000 board positions for 19s.
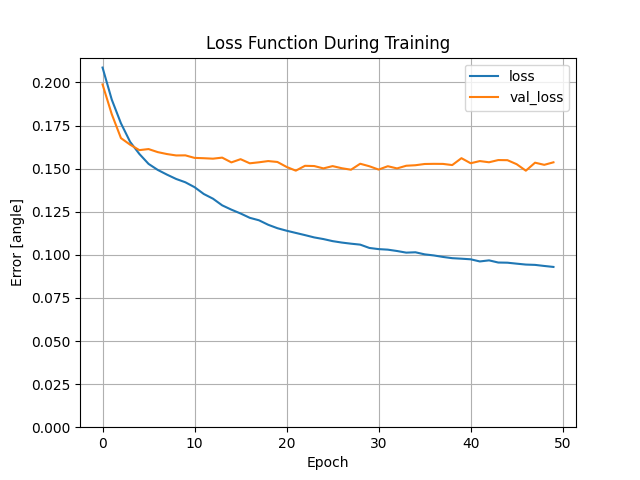
Several tutorials used the one-hot format to store their board positions, so I switched to that, and saw no improvement. This training took 17s.
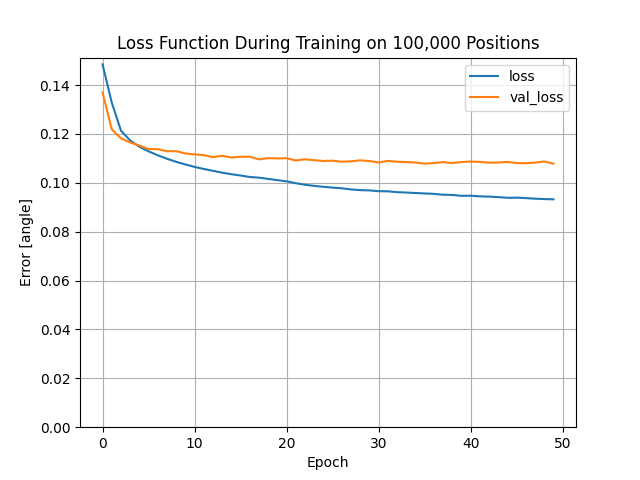
Training on 100,000 board positions seems to give better results, but it takes about 3 hours to generate that much data. There doesn’t seem to be a noticable difference between the +/- and the one-hot format. Here’s the +/- training that runs for about 2.5 minutes.
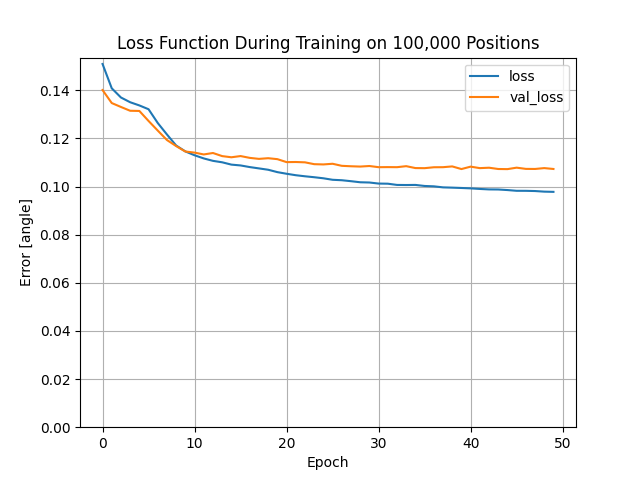
Here’s the one-hot training for the same data.
The next steps are to see if the model trains better with more layers, and see if the model can learn nearly as well on less data, so we can spend less than 3 hours generating position data for each iteration.
Here are results from learning on subsets of that same data set with both the positive / negative position data, as well as the one-hot position data.
| position count | +/- avg. loss | +/- time(s) | 1-hot avg. loss | 1-hot time(s) |
|---|---|---|---|---|
| 10,000 | 0.159 | 17 | 0.156 | 18 |
| 20,000 | 0.134 | 31 | 0.124 | 32 |
| 40,000 | 0.128 | 61 | 0.139 | 62 |
| 60,000 | 0.123 | 90 | 0.119 | 92 |
| 80,000 | 0.115 | 120 | 0.115 | 122 |
| 100,000 | 0.129 | 152 | 0.121 | 163 |
It looks like we don’t get much improvement past 50,000 positions, and I don’t see much difference between the two different data formats.
I tried changing the think time for each move from 0.1s to 2.0s and generated 50,000 positions. It took 28 hours, and the model had a validation loss of 0.161 - worse than the quick searches!